Library
Code, open data, and the occasional essay.
Retrieving and Generating Data using LLMs
Python code notebooks and slides to use API to access LLMs.
This open-source notebook collection and slides demonstrate two complementary LLM paradigms, retrieval and generation, for turning raw text into structured, research-ready data.
Retrieval notebooks show how to mine large document corpora to extract causal edges, stance labels, demographic attributes and other key fields (e.g., the pipeline powering www.causal.claims).
Generation notebooks start from minimal seed prompts and leverage the model's prior to build production networks, innovation profiles and context-aware keyword dictionaries (see aipnet.io and www.academicexpression.online).
Across both strands you will find hands-on modules for prompt engineering, JSON-schema enforcement, cost-efficient batch calling, embedding-based code mapping (HS6 / JEL) and validation routines such as modal voting and cosine sanity checks.
By the end, users can scale or adapt each workflow — whether analysing messy policy PDFs or constructing supply-chain graphs — while keeping costs predictable and outputs auditable.
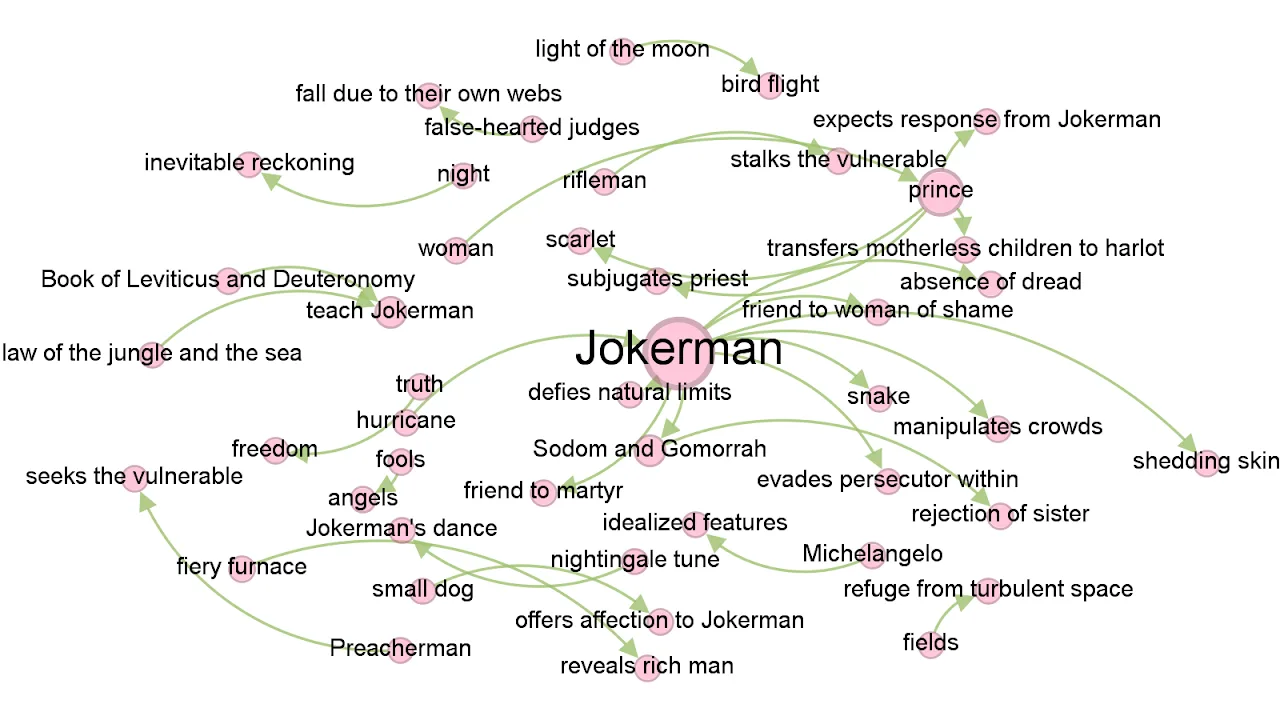
Mapping Bob Dylan's mind
I construct a Knowledge Graph from Dylan's lyrics (1962–2012).
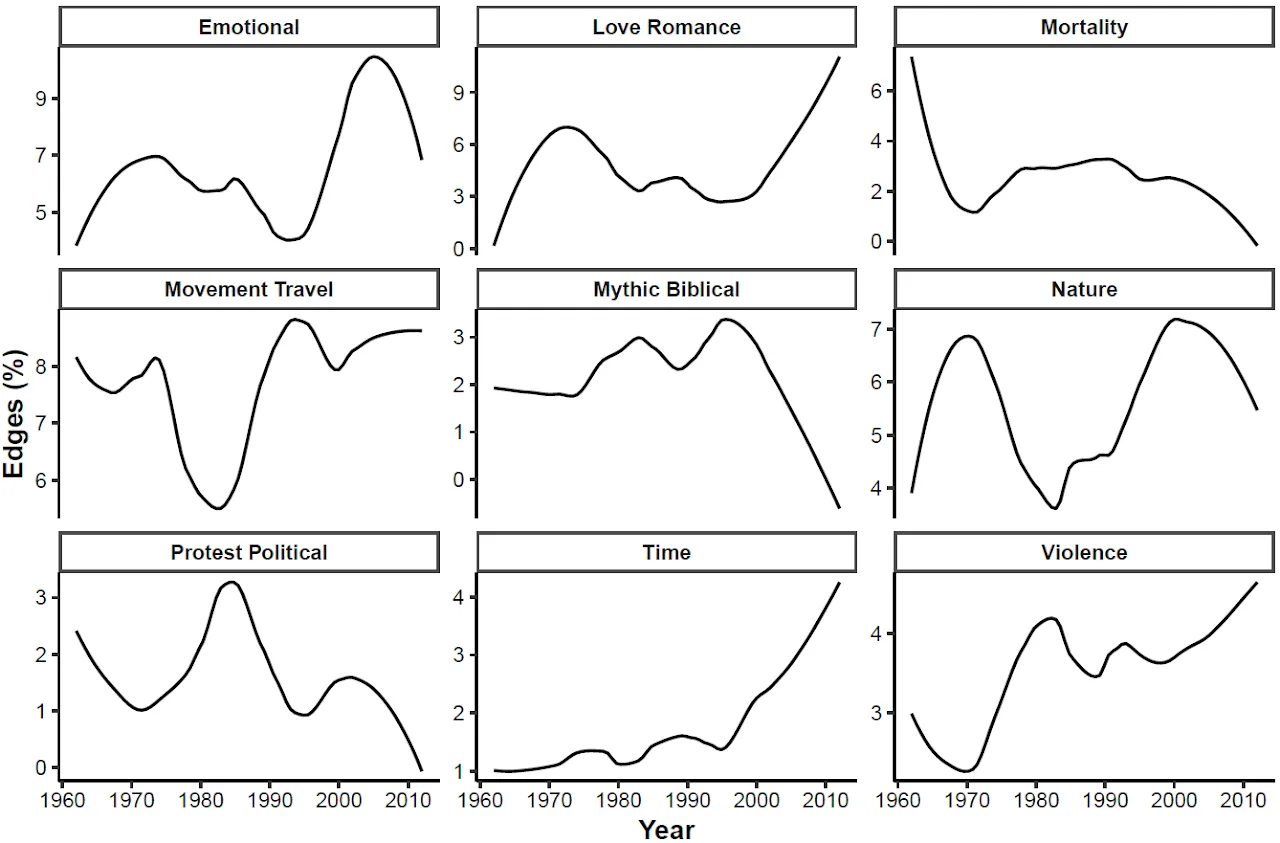
I tracked the evolution of key themes over time — from protest/political to mythic/biblical and movement/travel. The trends align closely with pivotal moments in Dylan's career.
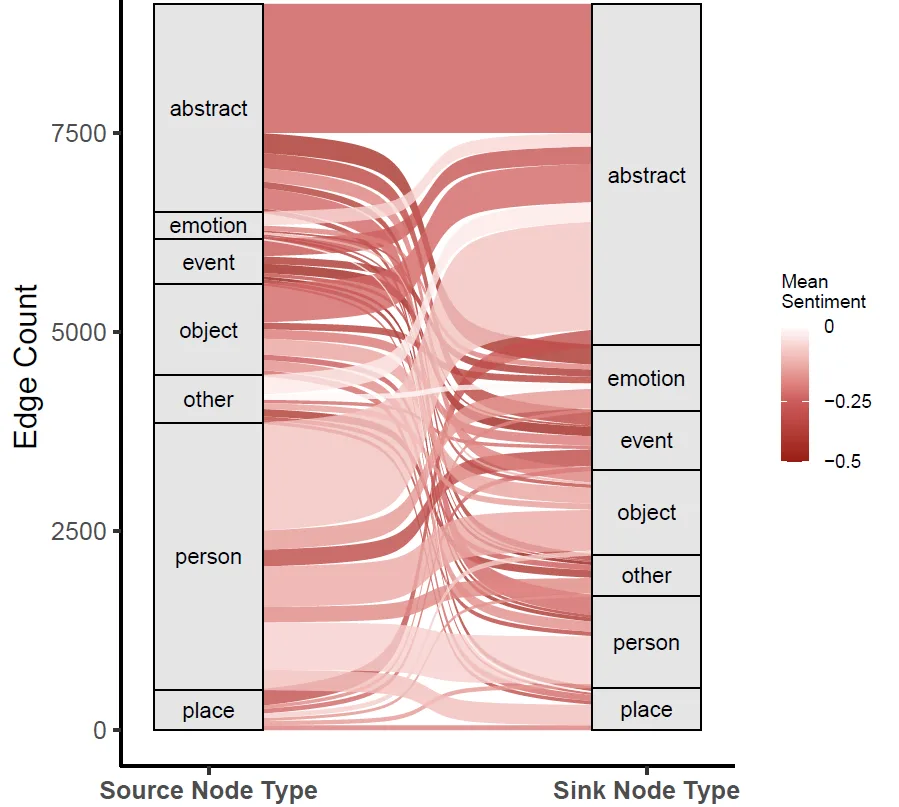
Next, I mapped transitions between different concept types (like person → abstract) and color-coded them by sentiment. This alluvial diagram uncovers the emotional dynamics woven into Dylan's lyrical connections.
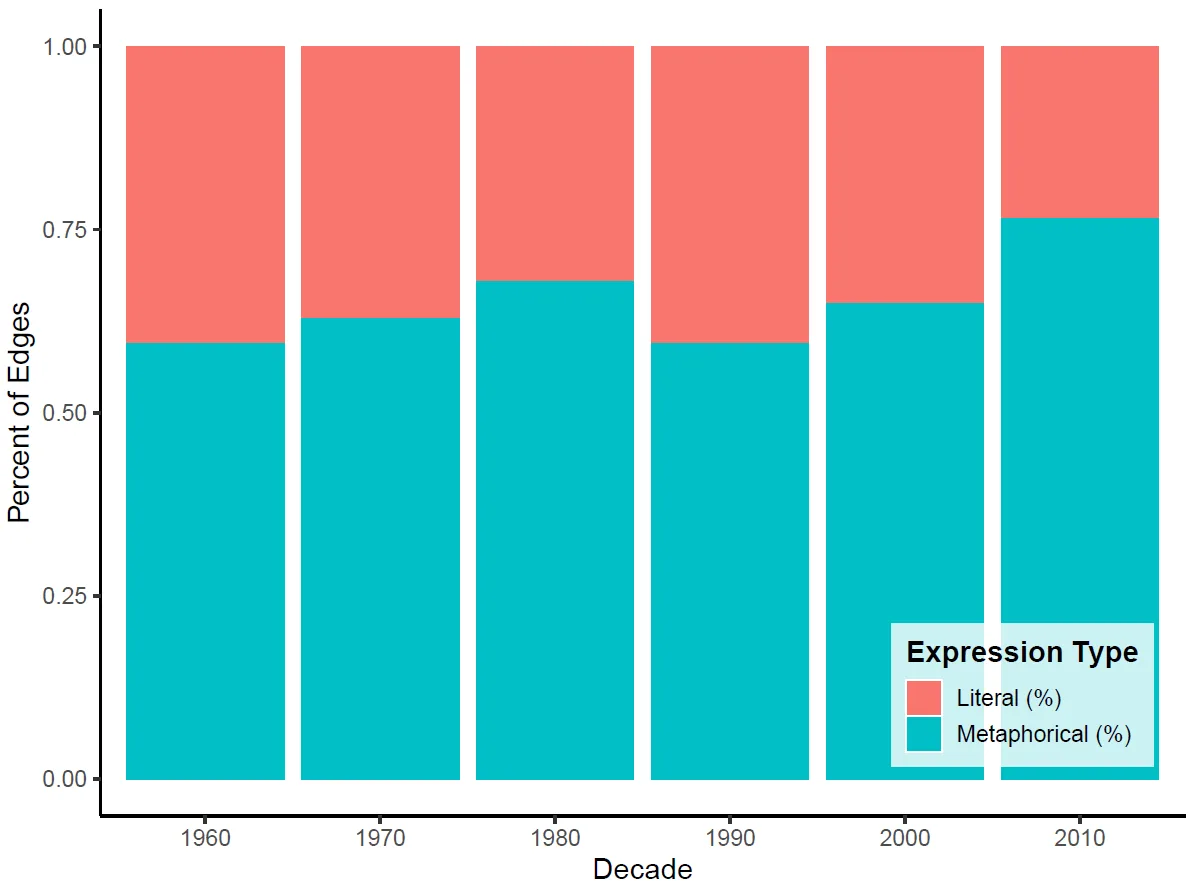
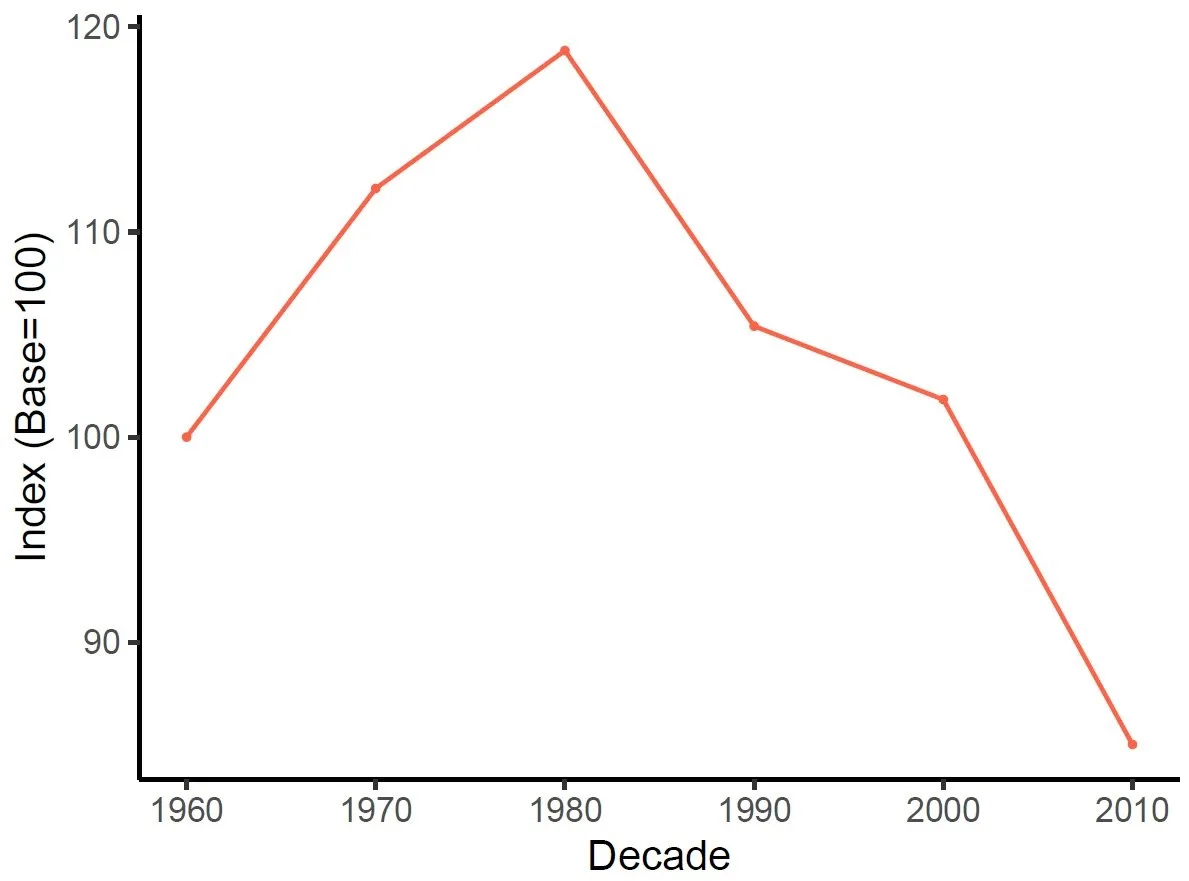
Dylan's lyrics shift from literal expression to an increasingly metaphorical style over the decades. This trend highlights his growing reliance on symbolic, emotionally charged language in his 70s.
Finally, by measuring the variance in eigenvector centrality, I quantified "dishabituation" — the mix of mainstream vs. peripheral concepts. The mid-career peak reveals Dylan's most eclectic and disruptive phase. Note, this is relative to his dishabituation state in the 60s.
Data — public goods
Datasets released alongside the papers, free to use with attribution.
Causal Claims in Economics — claim graphs
Evidence-annotated knowledge graph of ~45,000 economics papers (1980–2023): standardized concepts as nodes, stated causal and non-causal relationships as edges.
AIPNET — product-level input–output data
AI-generated production network over 5,000 HS products: directed input–output edges plus measures of product importance, with full data download.
Academic Expression — academics on social media
Data on the political stance and expression of 100,000+ academics (2016–2022), linking social media content to academic records.